A: It’s complicated…. but YES!
In this update of a post from July, we take stock of what’s new in tracking how lethal SARS-CoV-1 actually is.
First some definitions:
Case Fatality Rate (CFR): % of confirmed cases who die.
In the U.S., the estimated CFR is currently 2.9%
In the U.K., the estimated CFR is currently 9.3%
Since this number only includes CONFIRMED cases in the denominator, it is affected by the amount of testing and by asymptomatic or mild cases that never get tested. If only the most severe cases are tested, the CFR will be an overestimate of the real risk of dying while infected.
Infection Fatality Rate (IFR): % of ALL COVID-19 infections who die.
This is the number WE WANT TO KNOW. If infected, how likely is it that someone will die?
Obviously, the catch here is that to calculate the IFR you need accurate counts of ALL CASES and ALL DEATHS. Getting that DENOMINATOR right is the huge challenge right now. How many people have actually been infected?
One strategy that can help us get at this are “serology” tests—testing blood samples from the population for antibodies or evidence of previous COVID-19 infection.
So far, not many countries have what we call “population representative” seroprevalence studies to estimate the % of the population exposed. The U.S. CDC for example bases its seroprevalence estimates on convenience samples such as blood donors or blood collected for other purposes, of which the Nerdy Girls are not big fans.
People who donate blood or are otherwise not chosen randomly are usually different from the general population, and the resulting seroprevalence estimate may not reflect the reality in the whole country.
Spain has done one of the best *nationally representative* seroprevalence study thus far. They tested over 60,000 individuals with TWO DIFFERENT types of antibody tests to minimize false positives.
They estimated that around 5% of the Spanish population had been infected with SARS-CoV-2 by May, with higher levels (up to 14%) in hot spot areas.
So what does this mean for the Infection Fatality Rate (IFR)?
The population of Spain is around 47 million, so 5% would be 2.35 million infections.
With 28,396 confirmed deaths, up to that time, this gives an overall IFR of : 28,396/2,350,000….
*1.2%*
Using the “excess mortality” number from Spain (the number of people who died during this period above and beyond the averages from past years), of 48399, the IFR is *2.1%.*
England also did a population representative sero-survey of more than 109,000 participants, with an estimated 6% national seroprevalence by July. EXCLUDING deaths in nursing/care homes (where mortality was high), the overall IFR was estimated at 0.90%.
So what does this mean?
A 1% IFR is more than 10X WORSE that a bad seasonal flu season (0.1% estimated IFR).
Moreover, only 8% of the population typically gets the flu each year, because of vaccination and protection from previous exposures. COVID-19 has the potential to reach a MUCH larger fraction of the population.
We’ve seen some people saying it’s misleading to characterize this as 1% mortality rather than 99% survival from COVID-19. Believe us, the Nerdy Girls are thrilled that 99% of COVID infections are not fatal, but it’s important to put the 1% in context.
U.S. population = 330 million X 1%= 3.3 million people. Even if only 50% of the US population gets infected, that number is devastating.
Annual deaths attributed to flu in a *bad* season are around 66,000 deaths, more typically around 30,000-40,000.
Finally, it is important to remember that for many infections but especially COVID-19, a single IFR is not that informative. This is because there are HUGE differences in the IFR by age.
In the Spain example for instance, the IFR ranged from *12%* for those 80+ to 0.20% for those 50-59.
In England, the age-specific IFRs (again excluding care home deaths):
Ages 15-44: 0.03%
Ages 45-64: 0.52%
Ages 65-74 3.13%
Ages 75+: 11.64%
This is one reason why the overall CFR/IFR can change over time, depending on the ages of people getting infected.
So wouldn’t most of these deaths be among older people? As a % of expected deaths, yes. But using the CDC IFR estimate for 50-69 year olds (0.5%), that equates to *400,000* deaths in this age group if everyone was infected, or *200,000* for a 50% infection rate.
So while an IFR of 0.5% (or 0.005) *sounds* like a small number, keep your Nerdy radar up when people try to downplay this, and remind them what that means when multiplied by the size of the population.
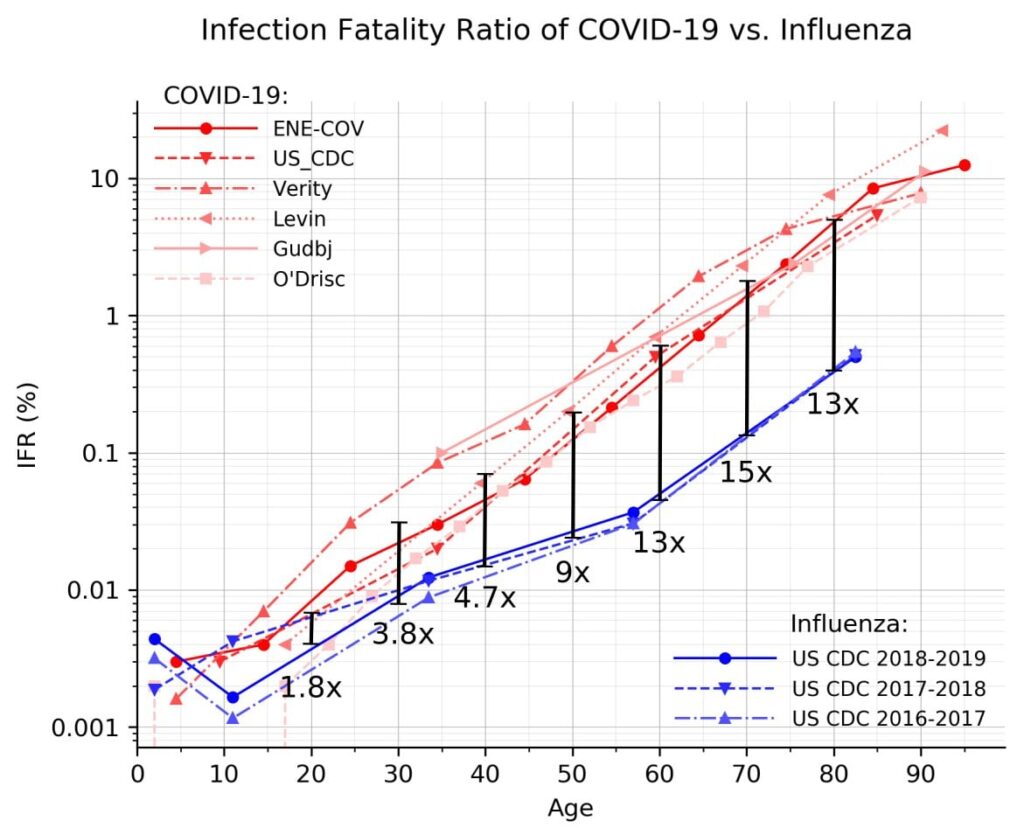
Doesn’t flu mortality also increase with age? Yes, the attached figure shows estimated IFRs for COVID versus recent flu seasons by age (note the y-axis is on log or relative scale). COVID is more fatal than flu for ages 30+, and depending on the estimate even for those ages 20+. We’ve known COVID-19 is rarely severe for kids, the one piece of consistent good news during this pandemic. But for everyone else the risk is higher than flu and rises very steeply with age.
BOTTOM LINE: While there are still many “known unknowns” in measuring COVID-19 mortality, our best estimates suggest this is WAY worse than the flu…like at least 10-15X worse.
AND as we continue to emphasize, death is only the tip of the iceberg as far as the physical effects of this virus, with growing evidence of significant long-term health effects for those infected and hospitalized.
Stay safe and stay sane!
Love,
Those Nerdy Girls
Useful mortality links:
Code and references for Flu/Covid figure
Additional links: